
This article assumes you have already deployed CockroachDB on a single Kubernetes cluster.
Despite CockroachDB's various built-in safeguards against failure, it is critical to actively monitor the overall health and performance of a cluster running in production and to create alerting rules that promptly send notifications when there are events that require investigation or intervention.
Configure Prometheus
Every node of a CockroachDB cluster exports granular timeseries metrics formatted for easy integration with Prometheus, an open source tool for storing, aggregating, and querying timeseries data. This section shows you how to orchestrate Prometheus as part of your Kubernetes cluster and pull these metrics into Prometheus for external monitoring.
This guidance is based on CoreOS's Prometheus Operator, which allows a Prometheus instance to be managed using built-in Kubernetes concepts.
If you're on Hosted GKE, before starting, make sure the email address associated with your Google Cloud account is part of the cluster-admin RBAC group, as shown in Deploy CockroachDB with Kubernetes.
From your local workstation, edit the
cockroachdbservice to add theprometheus: cockroachdblabel:$ kubectl label svc cockroachdb prometheus=cockroachdbservice/cockroachdb labeledThis ensures that only the
cockroachdb(not thecockroach-publicservice) is being monitored by a Prometheus job.$ kubectl label svc cockroachdb prometheus=cockroachdbservice/cockroachdb labeledThis ensures that only the
cockroachdb(not thecockroach-publicservice) is being monitored by a Prometheus job.$ kubectl label svc my-release-cockroachdb prometheus=cockroachdbservice/my-release-cockroachdb labeledThis ensures that there is a Prometheus job and monitoring data only for the
my-release-cockroachdbservice, not for themy-release-cockroach-publicservice.Determine the latest version of CoreOS's Prometheus Operator and run the following to download and apply the latest
bundle.yamldefinition file:Note:Be sure to specify the latest CoreOS Prometheus Operator version in the following command, in place of this example's use of version
v0.58.0.$ kubectl apply \ -f https://raw.githubusercontent.com/prometheus-operator/prometheus-operator/v0.58.0/bundle.yaml \ --server-sidecustomresourcedefinition.apiextensions.k8s.io/alertmanagers.monitoring.coreos.com serverside-applied customresourcedefinition.apiextensions.k8s.io/podmonitors.monitoring.coreos.com serverside-applied customresourcedefinition.apiextensions.k8s.io/probes.monitoring.coreos.com serverside-applied customresourcedefinition.apiextensions.k8s.io/prometheuses.monitoring.coreos.com serverside-applied customresourcedefinition.apiextensions.k8s.io/prometheusrules.monitoring.coreos.com serverside-applied customresourcedefinition.apiextensions.k8s.io/servicemonitors.monitoring.coreos.com serverside-applied customresourcedefinition.apiextensions.k8s.io/thanosrulers.monitoring.coreos.com serverside-applied clusterrolebinding.rbac.authorization.k8s.io/prometheus-operator serverside-applied clusterrole.rbac.authorization.k8s.io/prometheus-operator serverside-applied deployment.apps/prometheus-operator serverside-applied serviceaccount/prometheus-operator serverside-applied service/prometheus-operator serverside-appliedConfirm that the
prometheus-operatorhas started:$ kubectl get deploy prometheus-operatorNAME READY UP-TO-DATE AVAILABLE AGE prometheus-operator 1/1 1 1 27sDownload our Prometheus manifest:
$ curl -O https://raw.githubusercontent.com/cockroachdb/cockroach/master/cloud/kubernetes/prometheus/prometheus.yamlNote:By default, this manifest uses the secret name generated by the CockroachDB Kubernetes Operator. If you generated your own certificates and keys when starting CockroachDB, be sure that
ca.secret.namematches the name of the node secret you created.Apply the Prometheus manifest. This creates the various objects necessary to run a Prometheus instance:
$ kubectl apply -f prometheus.yamlserviceaccount/prometheus created clusterrole.rbac.authorization.k8s.io/prometheus created clusterrolebinding.rbac.authorization.k8s.io/prometheus created servicemonitor.monitoring.coreos.com/cockroachdb created prometheus.monitoring.coreos.com/cockroachdb createdAccess the Prometheus UI locally and verify that CockroachDB is feeding data into Prometheus:
Port-forward from your local machine to the pod running Prometheus:
$ kubectl port-forward prometheus-cockroachdb-0 9090Go to http://localhost:9090 in your browser.
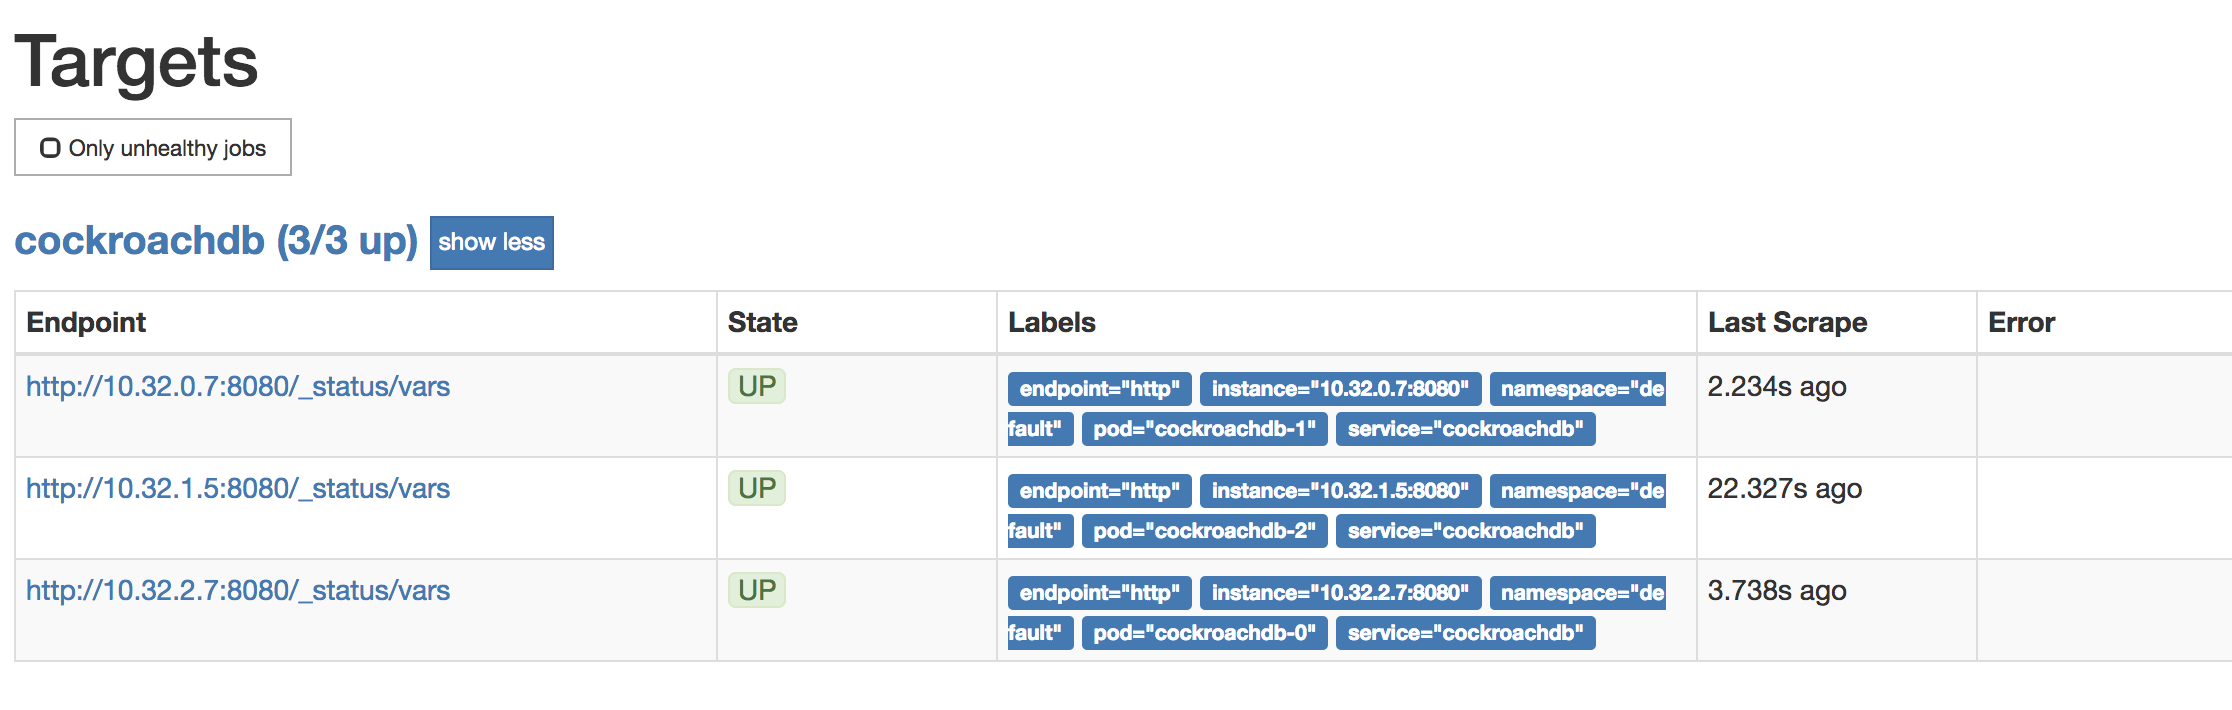
To verify that each CockroachDB node is connected to Prometheus, go to Status > Targets. The screen should look like this:
To verify that data is being collected, go to Graph, enter the
sys_uptimevariable in the field, click Execute, and then click the Graph tab. The screen should like this: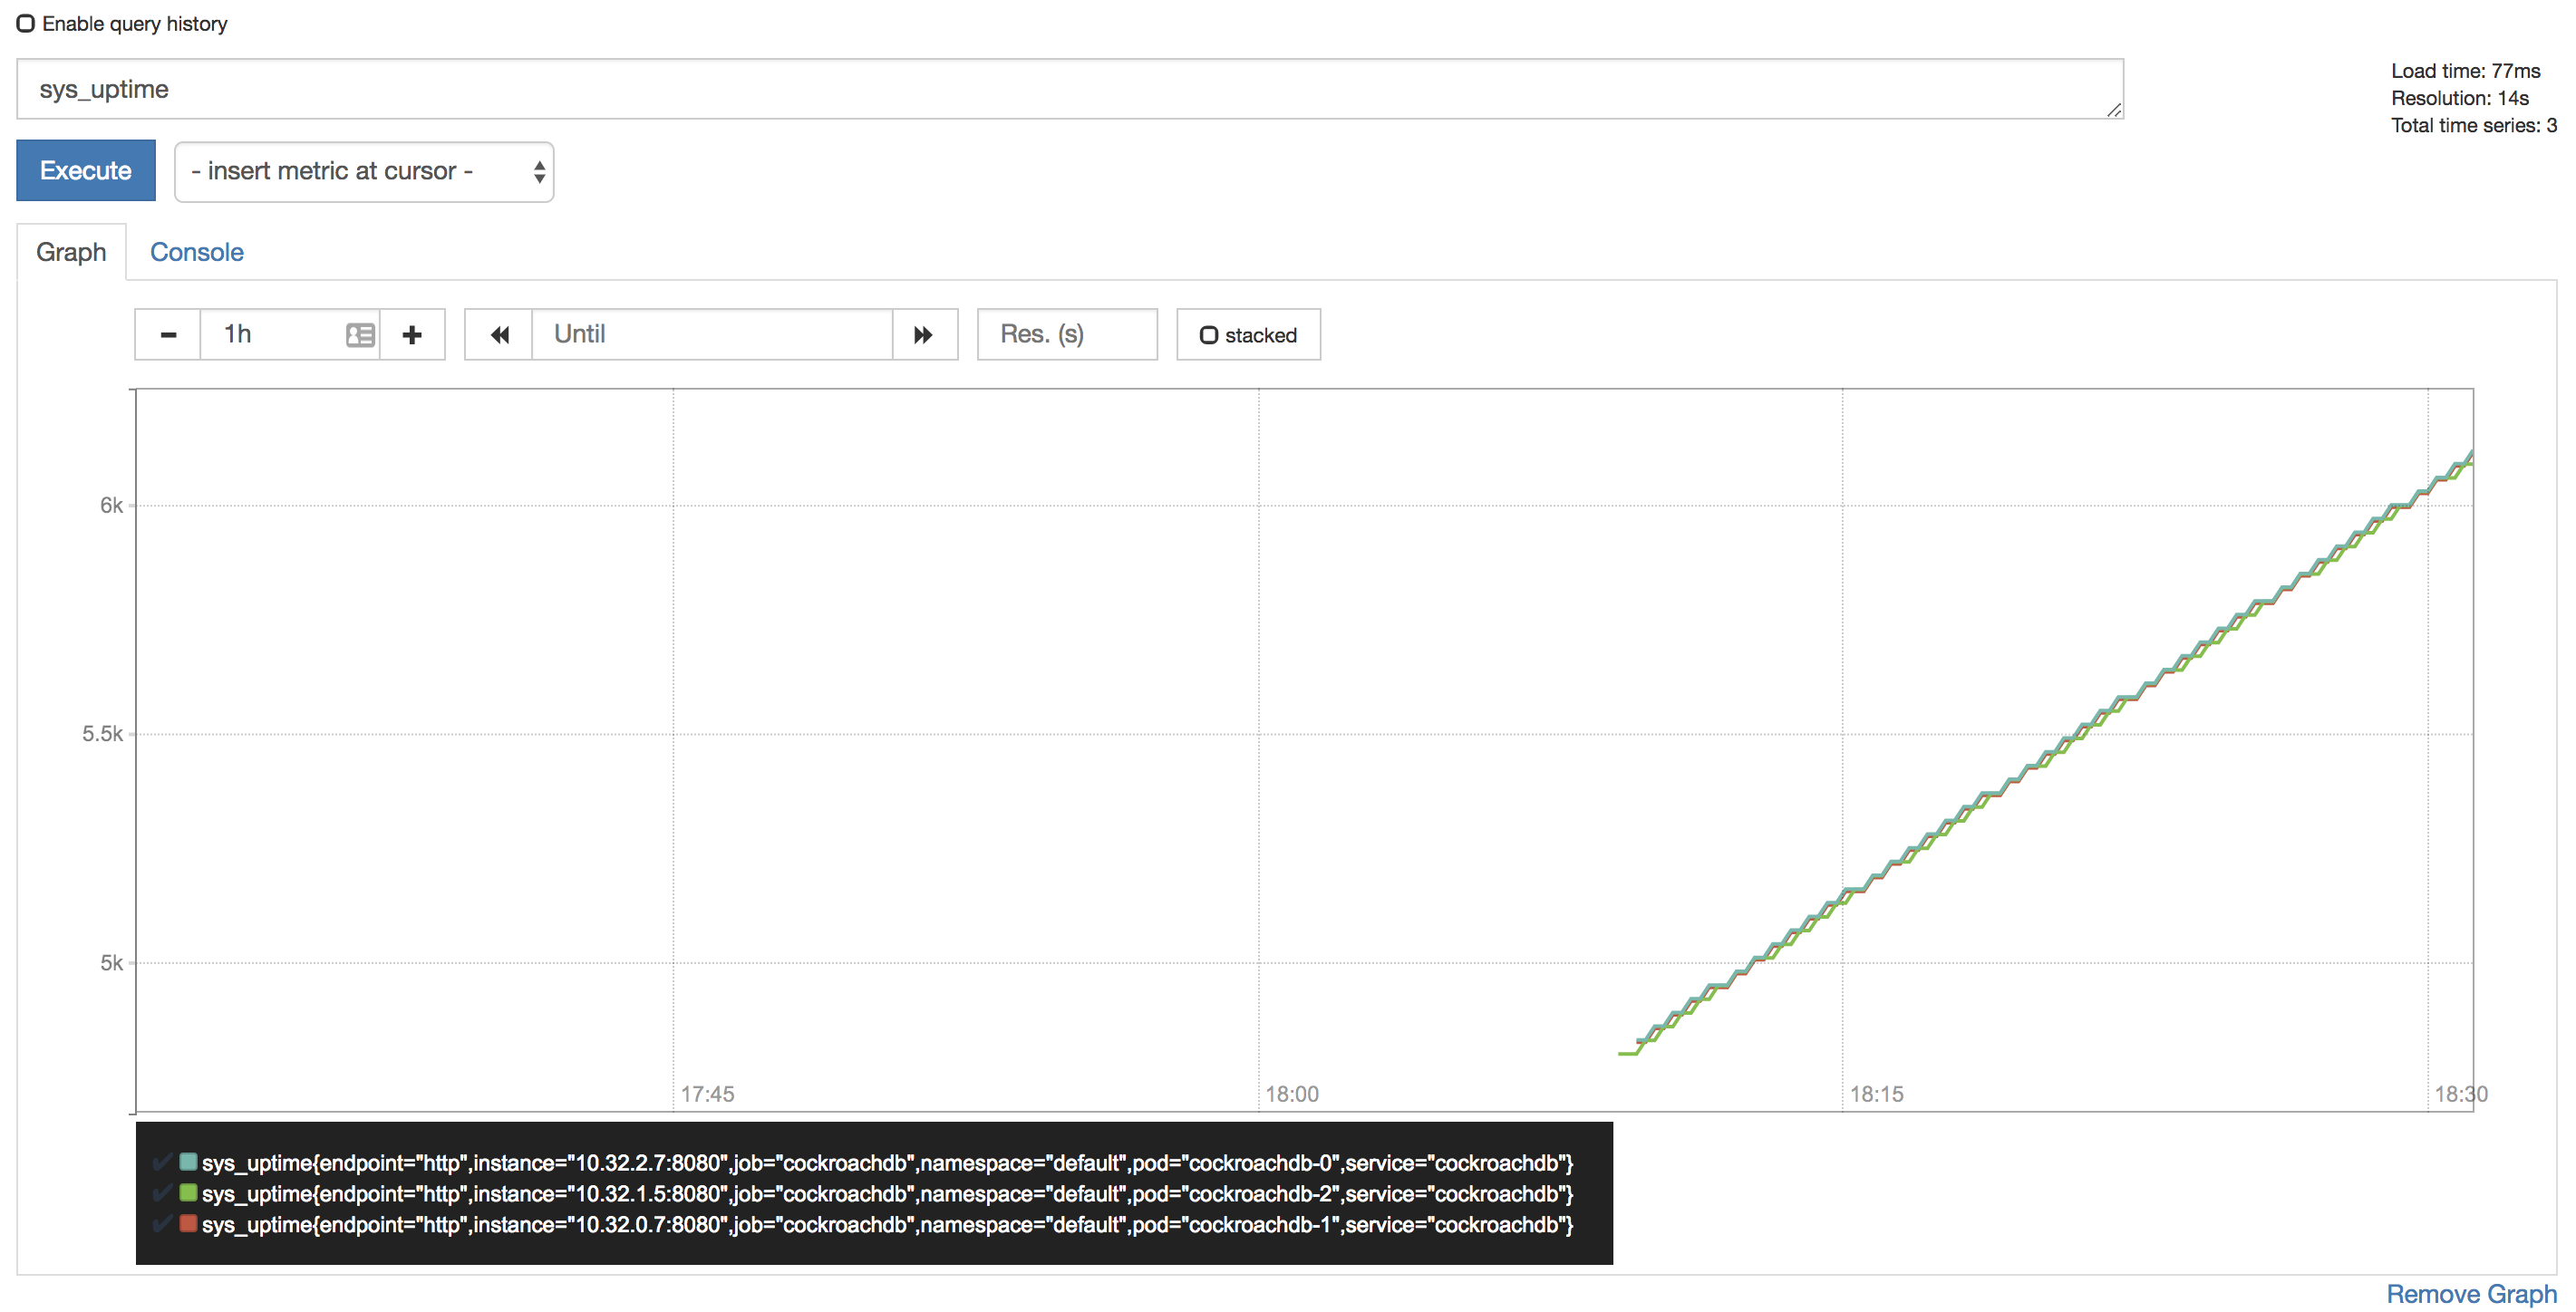
Tip:Prometheus auto-completes CockroachDB time series metrics for you, but if you want to see a full listing, with descriptions, port-forward as described in Access the DB Console and then point your browser to http://localhost:8080/_status/vars.
For more details on using the Prometheus UI, see their official documentation.
Configure Alertmanager
Active monitoring helps you spot problems early, but it is also essential to send notifications when there are events that require investigation or intervention. This section shows you how to use Alertmanager and CockroachDB's starter alerting rules to do this.
Download our
alertmanager-config.yamlconfiguration file:$ curl -O \ https://raw.githubusercontent.com/cockroachdb/cockroach/master/cloud/kubernetes/prometheus/alertmanager-config.yamlEdit the
alertmanager-config.yamlfile to specify the desired receivers for notifications. Initially, the file contains a placeholder web hook.Add this configuration to the Kubernetes cluster as a secret, renaming it to
alertmanager.yamland labelling it to make it easier to find:$ kubectl create secret generic alertmanager-cockroachdb \ --from-file=alertmanager.yaml=alertmanager-config.yamlsecret/alertmanager-cockroachdb created$ kubectl label secret alertmanager-cockroachdb app=cockroachdbsecret/alertmanager-cockroachdb labeledWarning:The name of the secret,
alertmanager-cockroachdb, must match the name used in thealertmanager.yamlfile. If they differ, the Alertmanager instance will start without configuration, and nothing will happen.Use our
alertmanager.yamlfile to create the various objects necessary to run an Alertmanager instance, including a ClusterIP service so that Prometheus can forward alerts:$ kubectl apply \ -f https://raw.githubusercontent.com/cockroachdb/cockroach/master/cloud/kubernetes/prometheus/alertmanager.yamlalertmanager.monitoring.coreos.com/cockroachdb created service/alertmanager-cockroachdb createdVerify that Alertmanager is running:
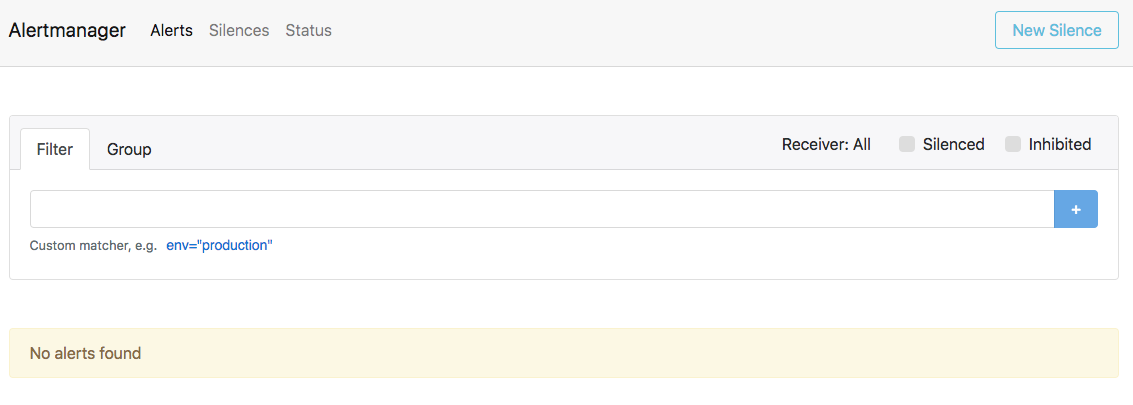
Port-forward from your local machine to the pod running Alertmanager:
$ kubectl port-forward alertmanager-cockroachdb-0 9093Go to http://localhost:9093 in your browser. The screen should look like this:
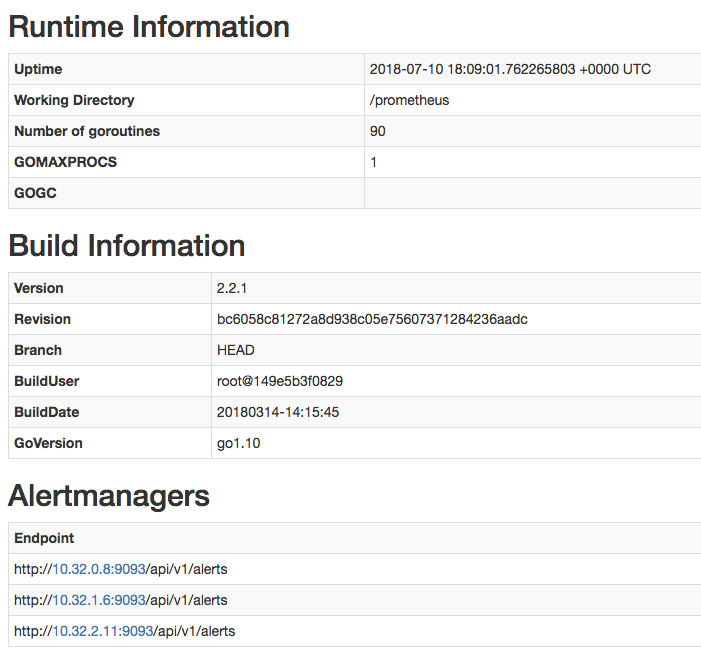
Ensure that the Alertmanagers are visible to Prometheus by opening http://localhost:9090/status. The screen should look like this:
Add CockroachDB's starter alerting rules:
$ kubectl apply \
-f https://raw.githubusercontent.com/cockroachdb/cockroach/master/cloud/kubernetes/prometheus/alert-rules.yaml
prometheusrule.monitoring.coreos.com/prometheus-cockroachdb-rules createdEnsure that the rules are visible to Prometheus by opening http://localhost:9090/rules. The screen should look like this:
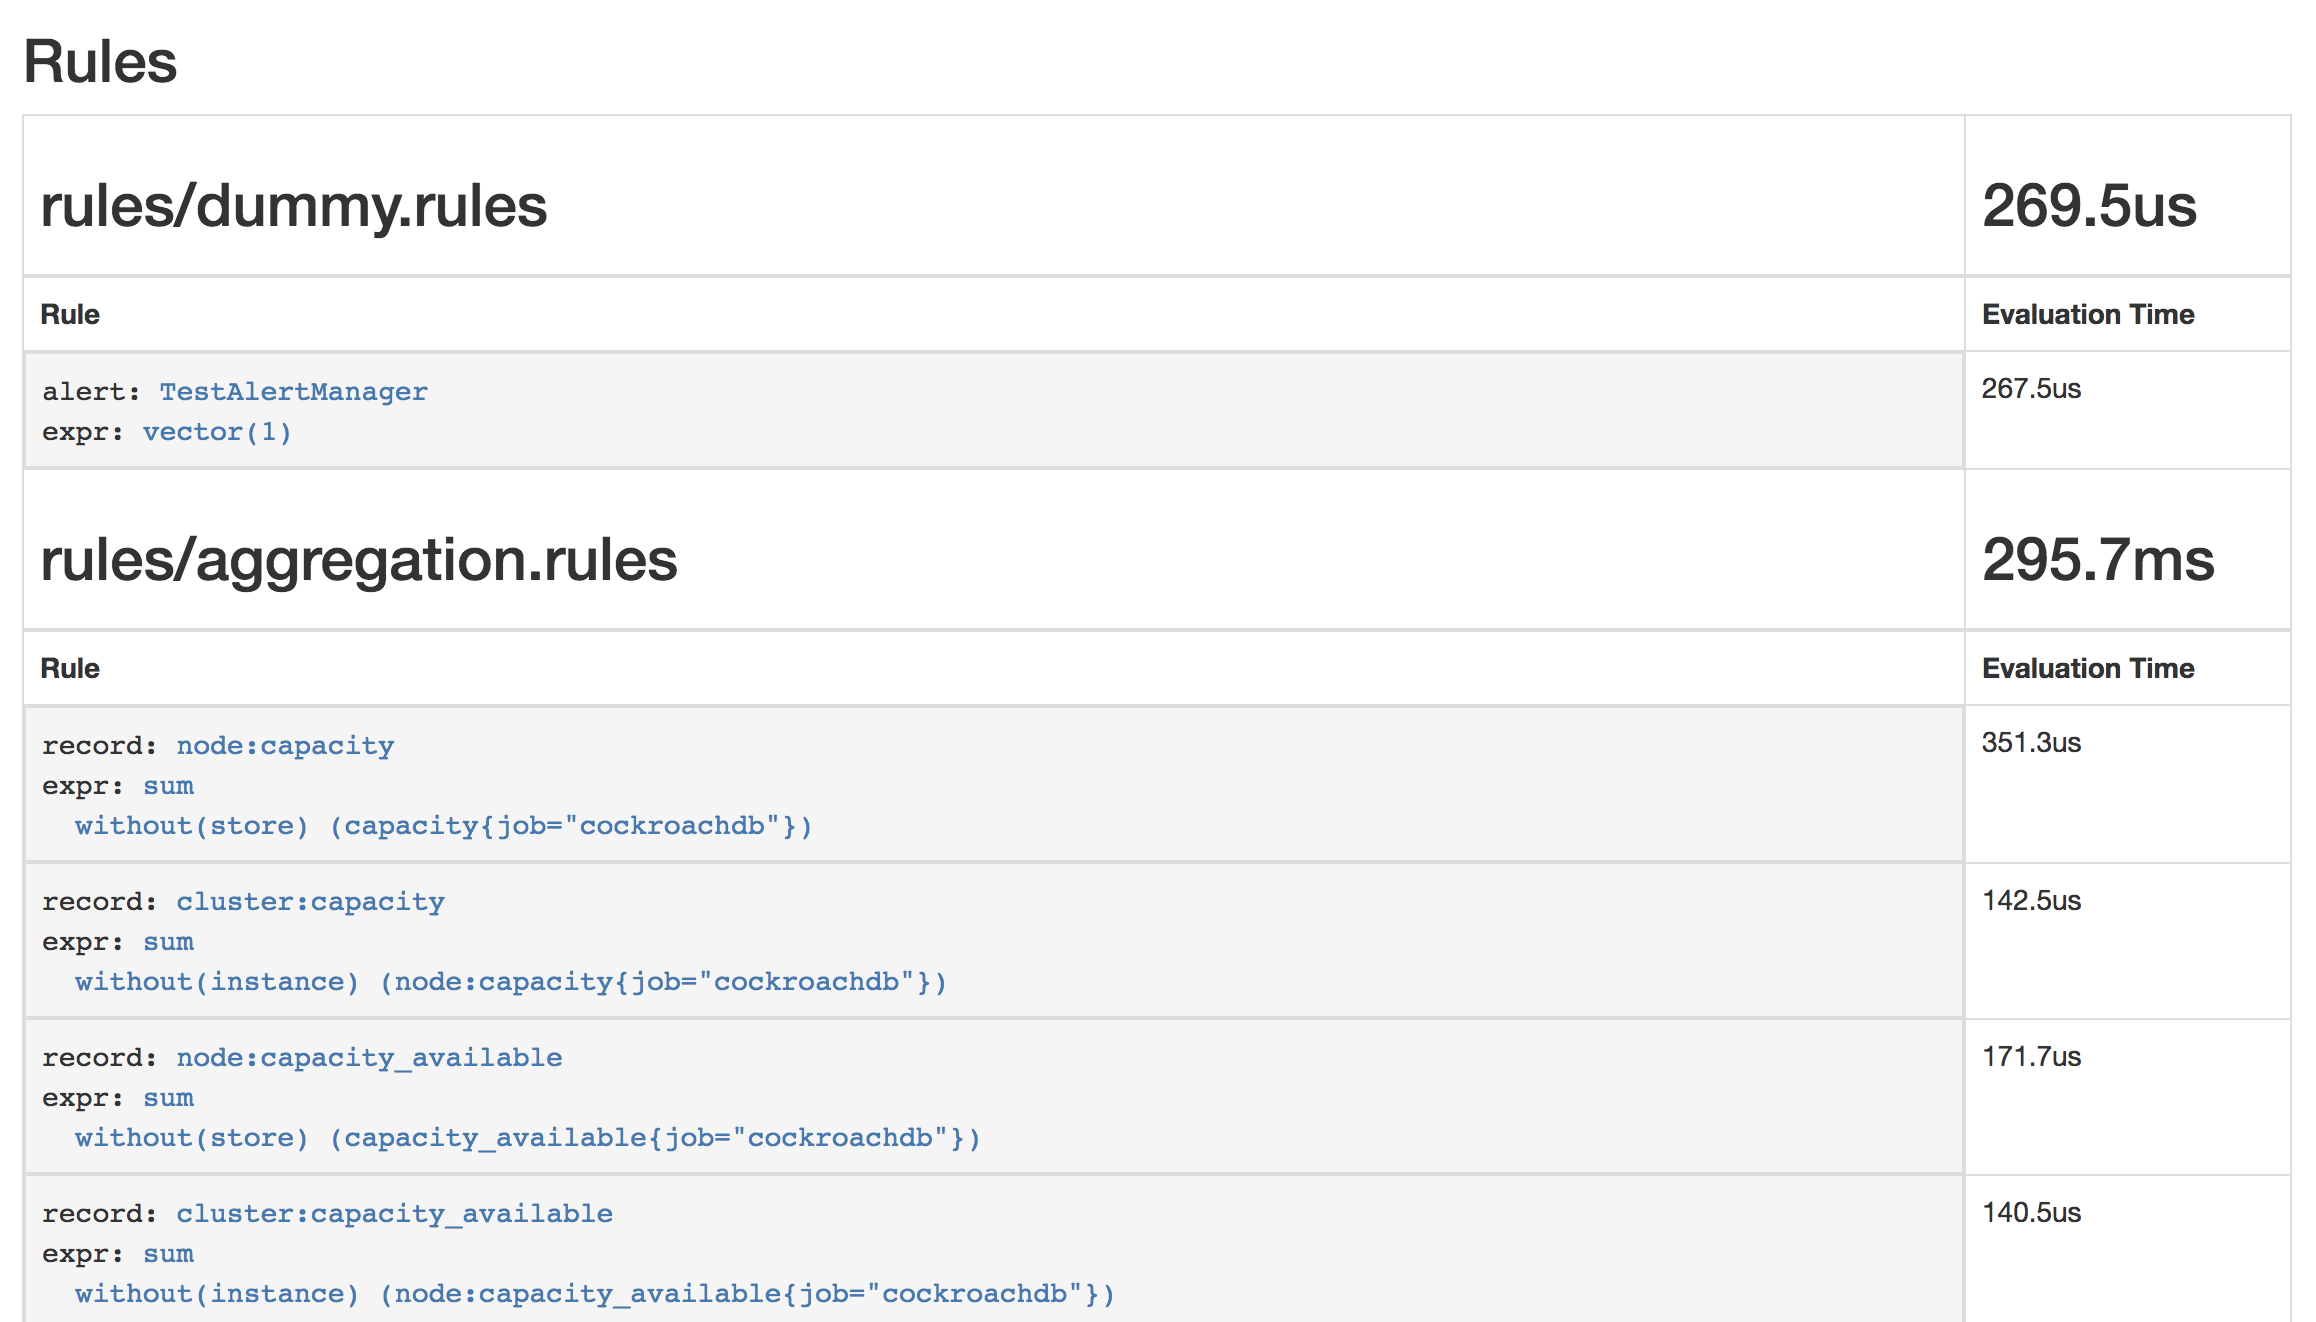
Verify that the
TestAlertManagerexample alert is firing by opening http://localhost:9090/alerts. The screen should look like this: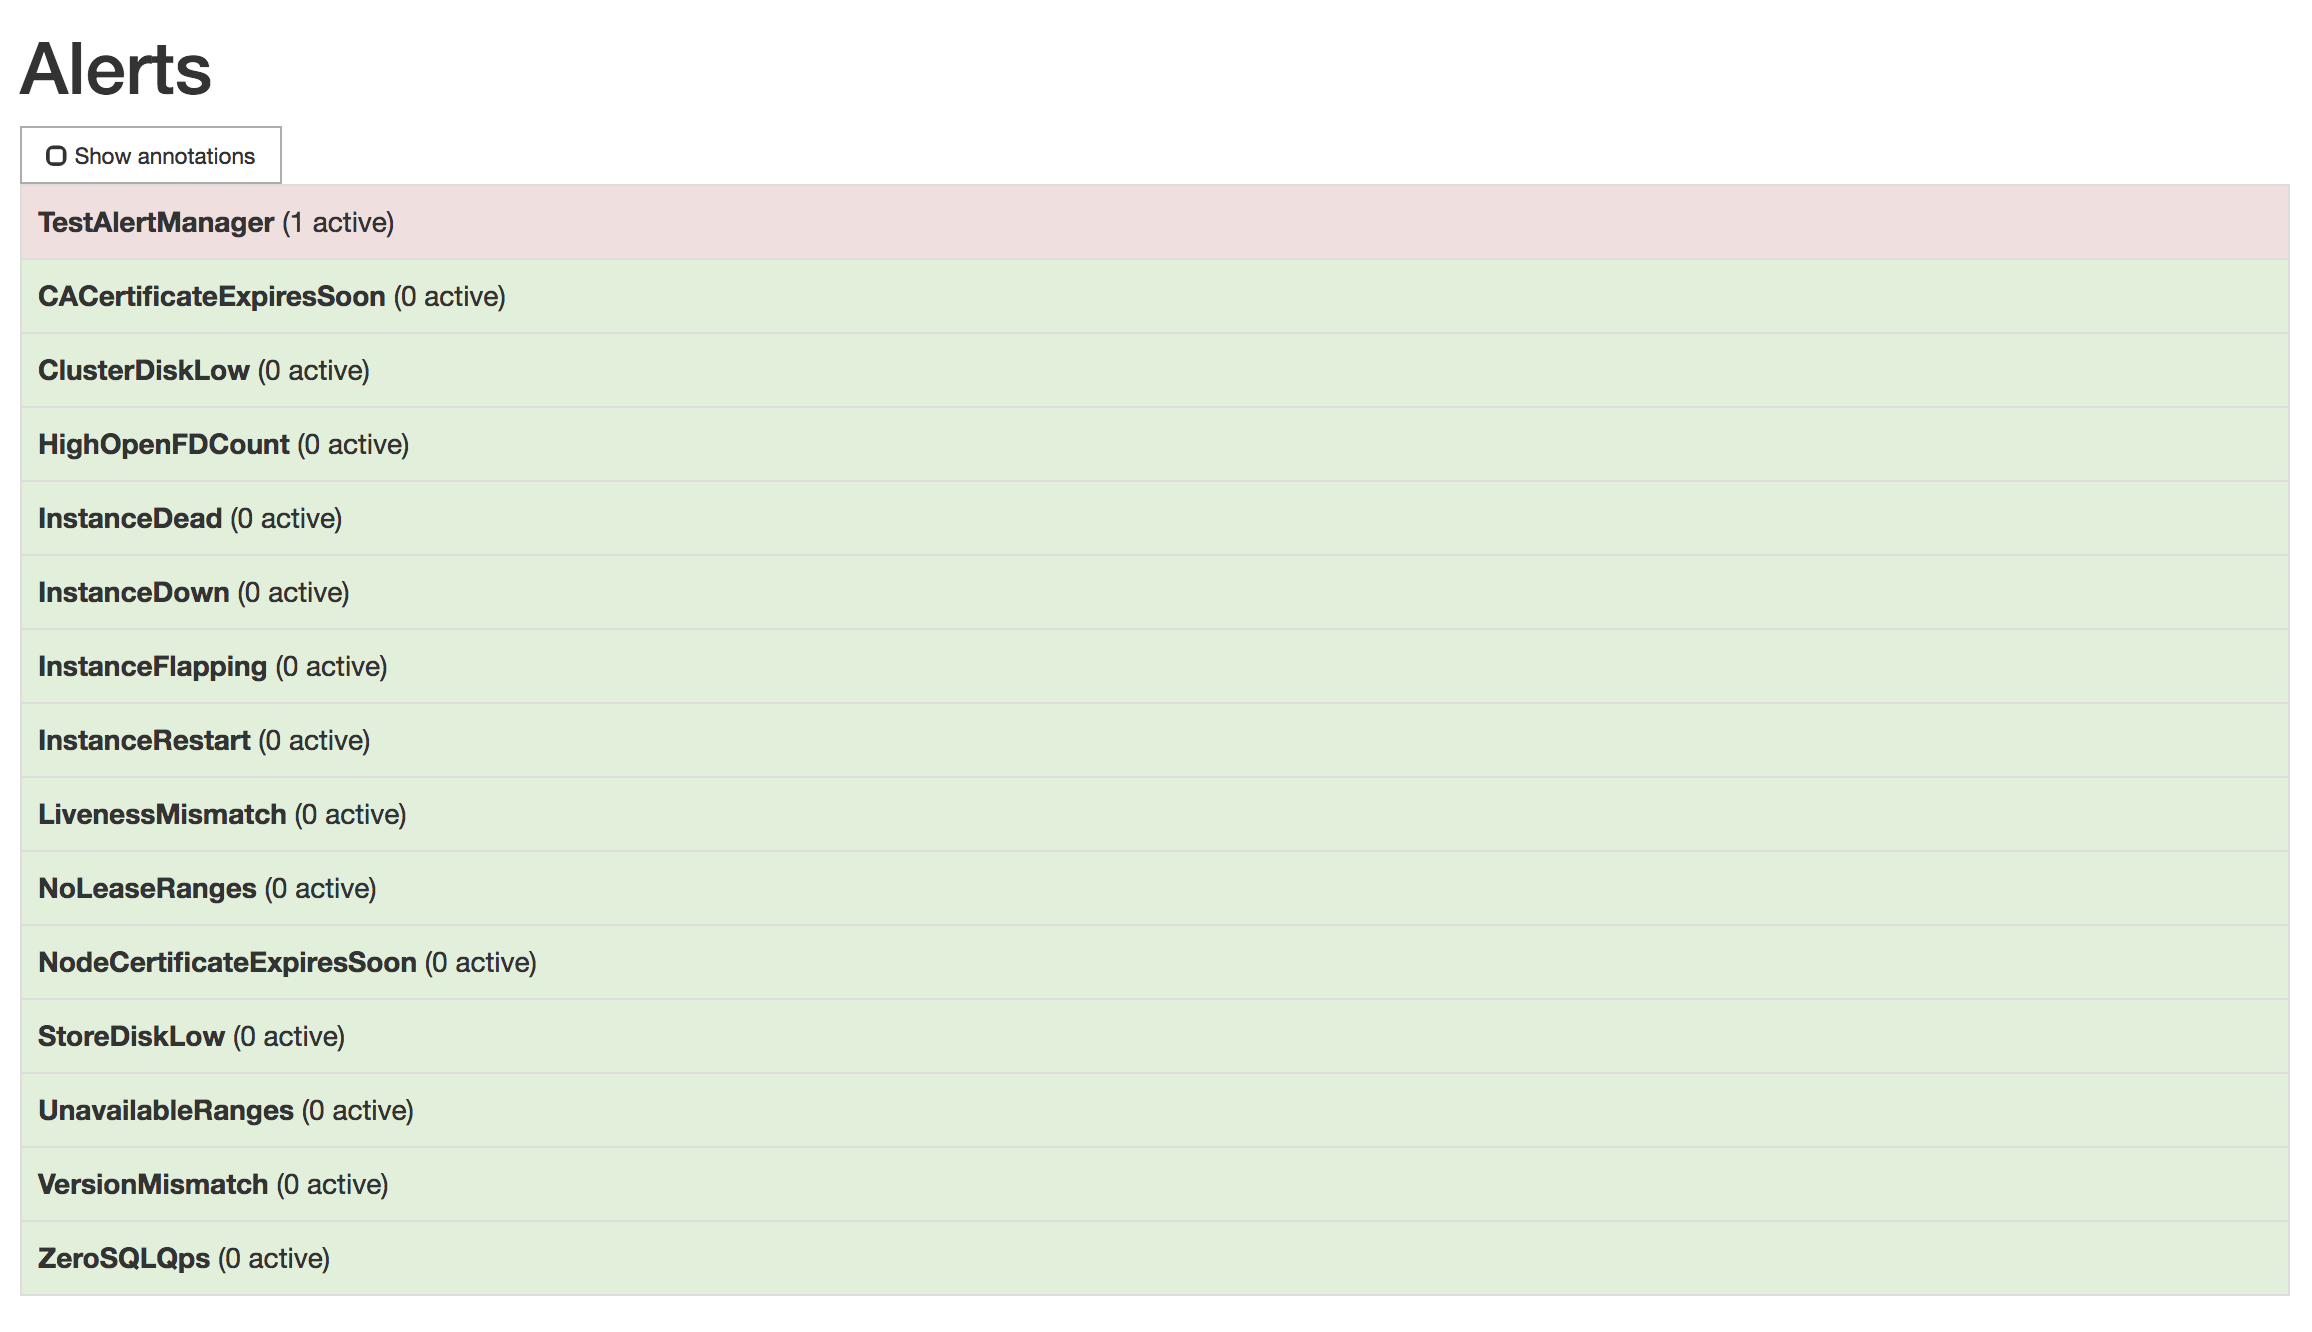
To remove the example alert:
Use the
kubectl editcommand to open the rules for editing:$ kubectl edit prometheusrules prometheus-cockroachdb-rulesRemove the
dummy.rulesblock and save the file:- name: rules/dummy.rules rules: - alert: TestAlertManager expr: vector(1)
